Case Studies

A closer look at the research, decisions, and evidence behind my work.
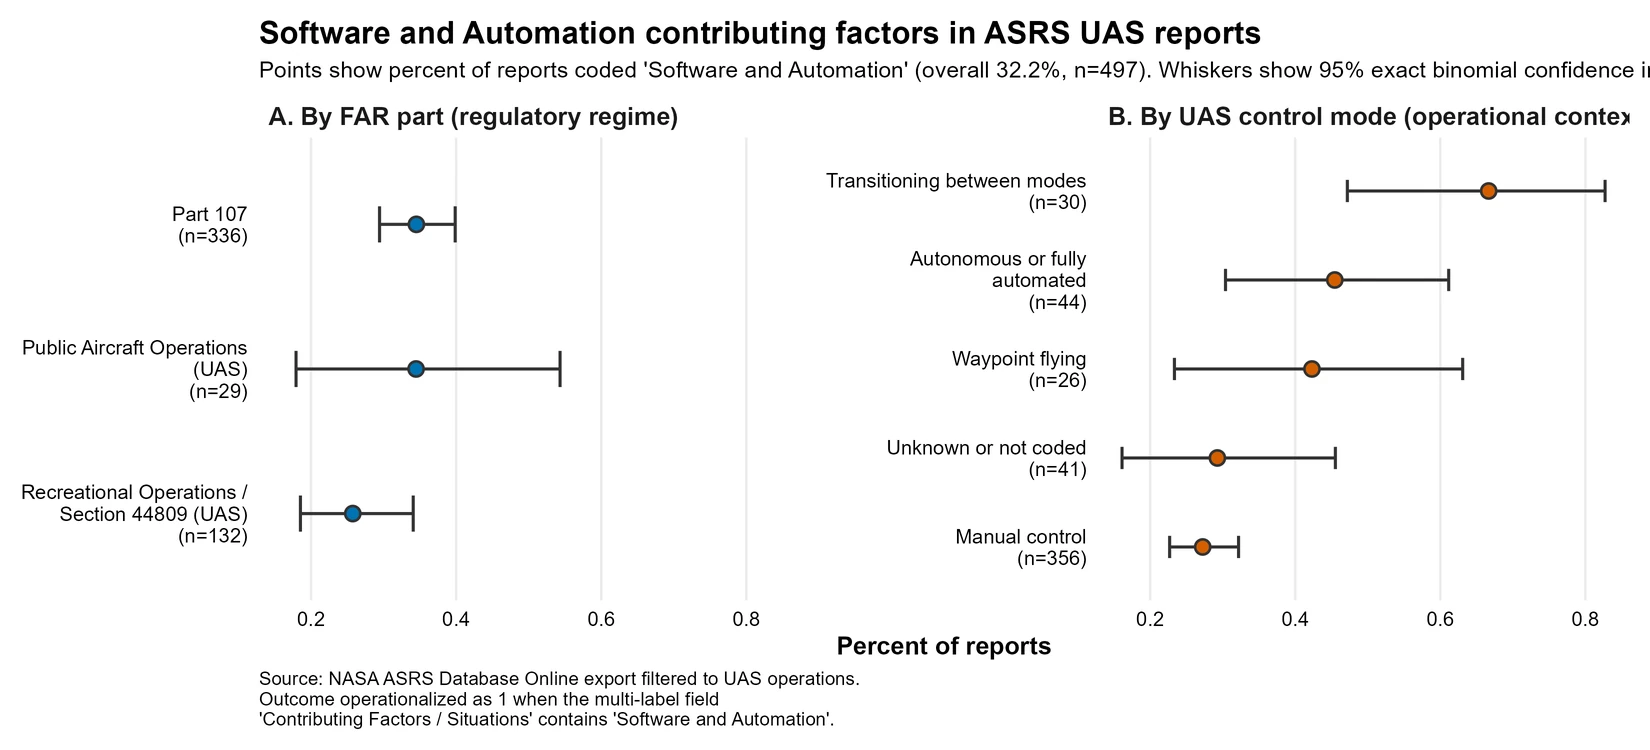
  1. Two-panel dot plot of the share of NASA ASRS UAS reports coded Software and Automation (overall 32.2 percent of 497 reports), each point with a 95% exact binomial confidence interval. Panel A splits the reports by FAR part, Panel B by UAS control mode; transitioning between modes sits highest and manual control lowest.01HSE 5312026Individual

    Software and Automation Coding in UAS Reports

    Does the share of NASA Aviation Safety Reporting System (ASRS) uncrewed aircraft system (UAS) reports coded Software and Automation differ across regulatory regime and control mode, and how large do those differences look once uncertainty is shown?

    Descriptive analysis of 497 reports.

    Read Case Study
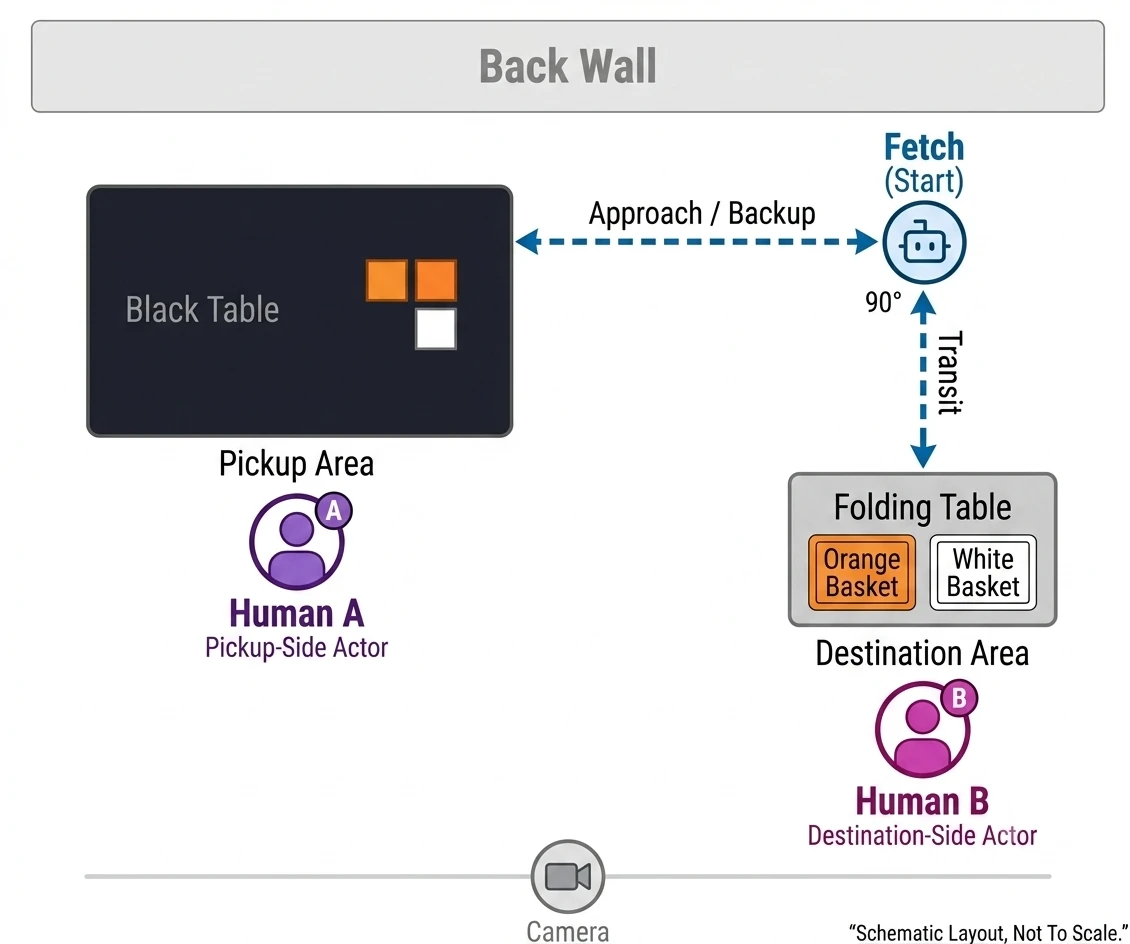
  2. Top-down schematic of the filming room. Fetch starts at upper right. A black pickup table with Human A is at left. A folding table with an orange and a white basket and Human B is at lower right. The camera sits along the bottom edge.02Independent research2026Proposal stage

    Observer paradigm for robot-teammate trust

    Does the decision-rights structure of a human-robot team change how an outside observer judges the robot's trustworthiness?

    Proposal stage, no data collected.

    Read Case Study
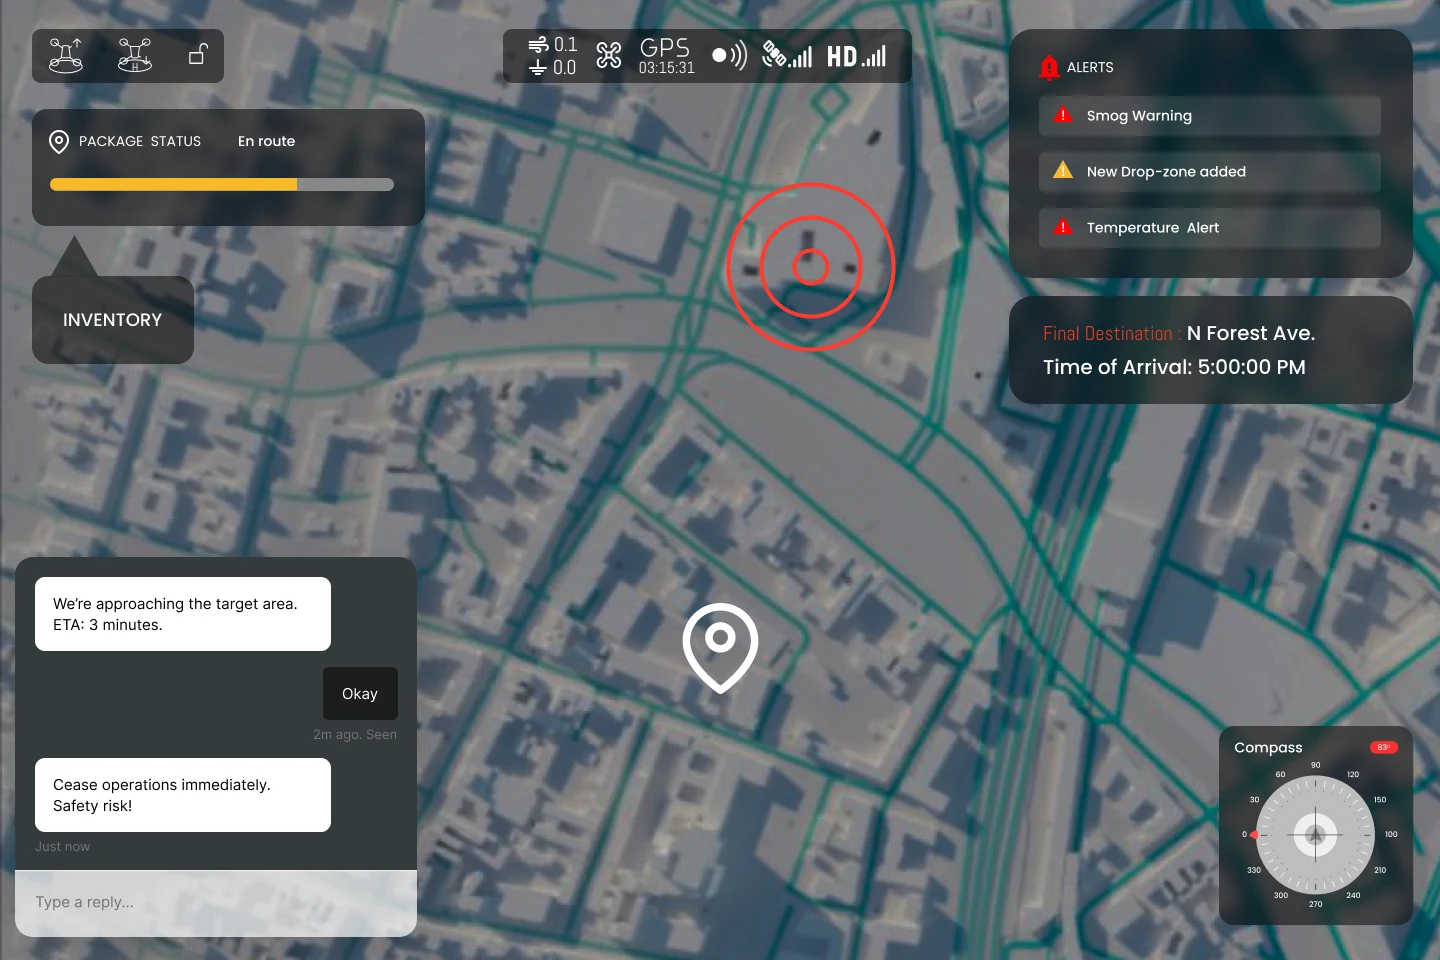
  3. Payload operator view over a 3D city map: package status en route with a progress bar and an inventory button, an alerts panel (smog warning, new drop zone added, temperature alert), the final destination and arrival time, a drop-zone target marker, a compass, and an operator chat reading Cease operations immediately. Safety risk!03HSE 5422024Team of six

    CrisisCourier UAS operator displays

    How could a disaster-relief UAS assign routine flight tasks to automation while keeping mission decisions with its pilot, navigator, and payload operator?

    Design concept, not tested with operators.

    Read Case Study
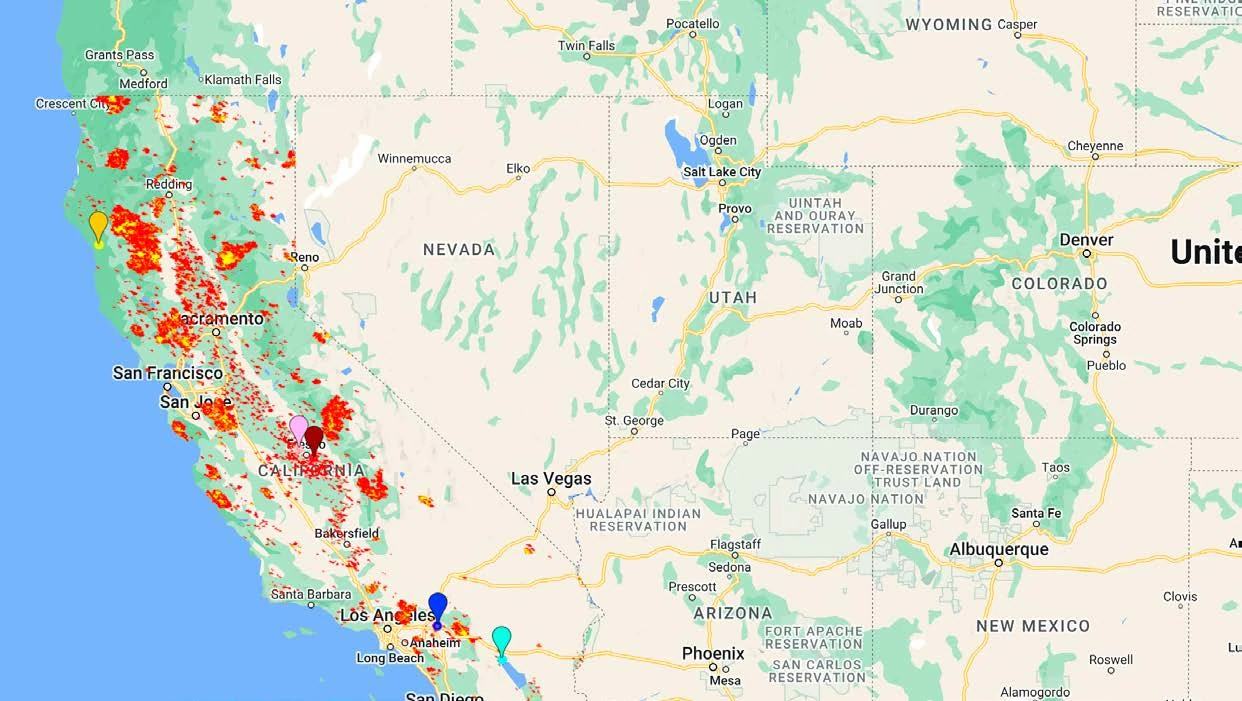
  4. Team map of the western United States on a Google basemap. Red and yellow patches of MODIS active-fire detections cover much of northern and central California. Five colored pins mark selected ZIP codes, including two at Fresno inside a dense cluster of detections.04Hackathon2023Team of four

    SpaceHACK for Sustainability

    Where do wildfire risk and social disparity meet at the wildland-urban interface, and how could forest thinning reduce fire severity while supporting lower-income communities?

    Hackathon concept, Honorable Mention.

    Read Case Study